Welcome to My Creative Journey

Exploring digital media and web development through projects and reflections

About Me

Yihan Liu

Hello, I'm Yihan Liu

I'm a passionate learner and creator with a focus on digital media and web development. My journey in technology started with a curiosity about how websites and digital platforms work, and has evolved into a commitment to building meaningful digital experiences.

My Interests

  • Web Development (HTML, CSS, JavaScript)
  • Digital Media Production
  • Data Analysis and Visualization

Skills

HTML5 JavaScript Web Scraping Content Creation

My Projects

A selection of my work showcasing skills in photography and 3D scene construction.

UE5 Scene Construction

Immersive 3D environment created with Unreal Engine 5 featuring advanced lighting and materials.

Project Details

  • Created using Unreal Engine 5.1
  • Utilizes Lumen global illumination
  • Includes custom materials and shaders
  • Features dynamic lighting and weather system
  • Optimized for real-time performance

More Projects

Additional creative works and experiments in various digital media formats.

🔨

New media account management

Please waiting

🎨

Digital Painting Series

Please waiting

💻

web design

Please waiting

Learning Reflection

Documenting my journey, challenges, and discoveries in digital media and web development.

Week 1

We had an introduction to digital media, exploring the fundamentals and applications in modern technology. I learned about the various forms of digital media and how they shape our interactions with technology.

Week 2

Today, we attempted to create a personal webpage, learning the basics of HTML structure and web development. This was my first hands-on experience with coding, and I gained an understanding of how HTML elements work together to create content.

Week 3

This week, we learned how to use web crawlers—a specialized tool designed to collect targeted data from websites, such as video file sizes and durations on streaming platforms. Compared with manual data collection, web crawlers drastically enhance the efficiency of data acquisition and integration, laying a solid foundation for subsequent analytical processes. For instance, if we aim to obtain the list of films in this year’s Douban Top 250, crawlers can automatically extract the required information, eliminating the tediousness of repetitive manual operations (Zhang et al., 2021). This efficient data-gathering method enables large-scale data analysis, empowering users to quickly uncover valuable insights hidden within the data.

Here's the process we followed:

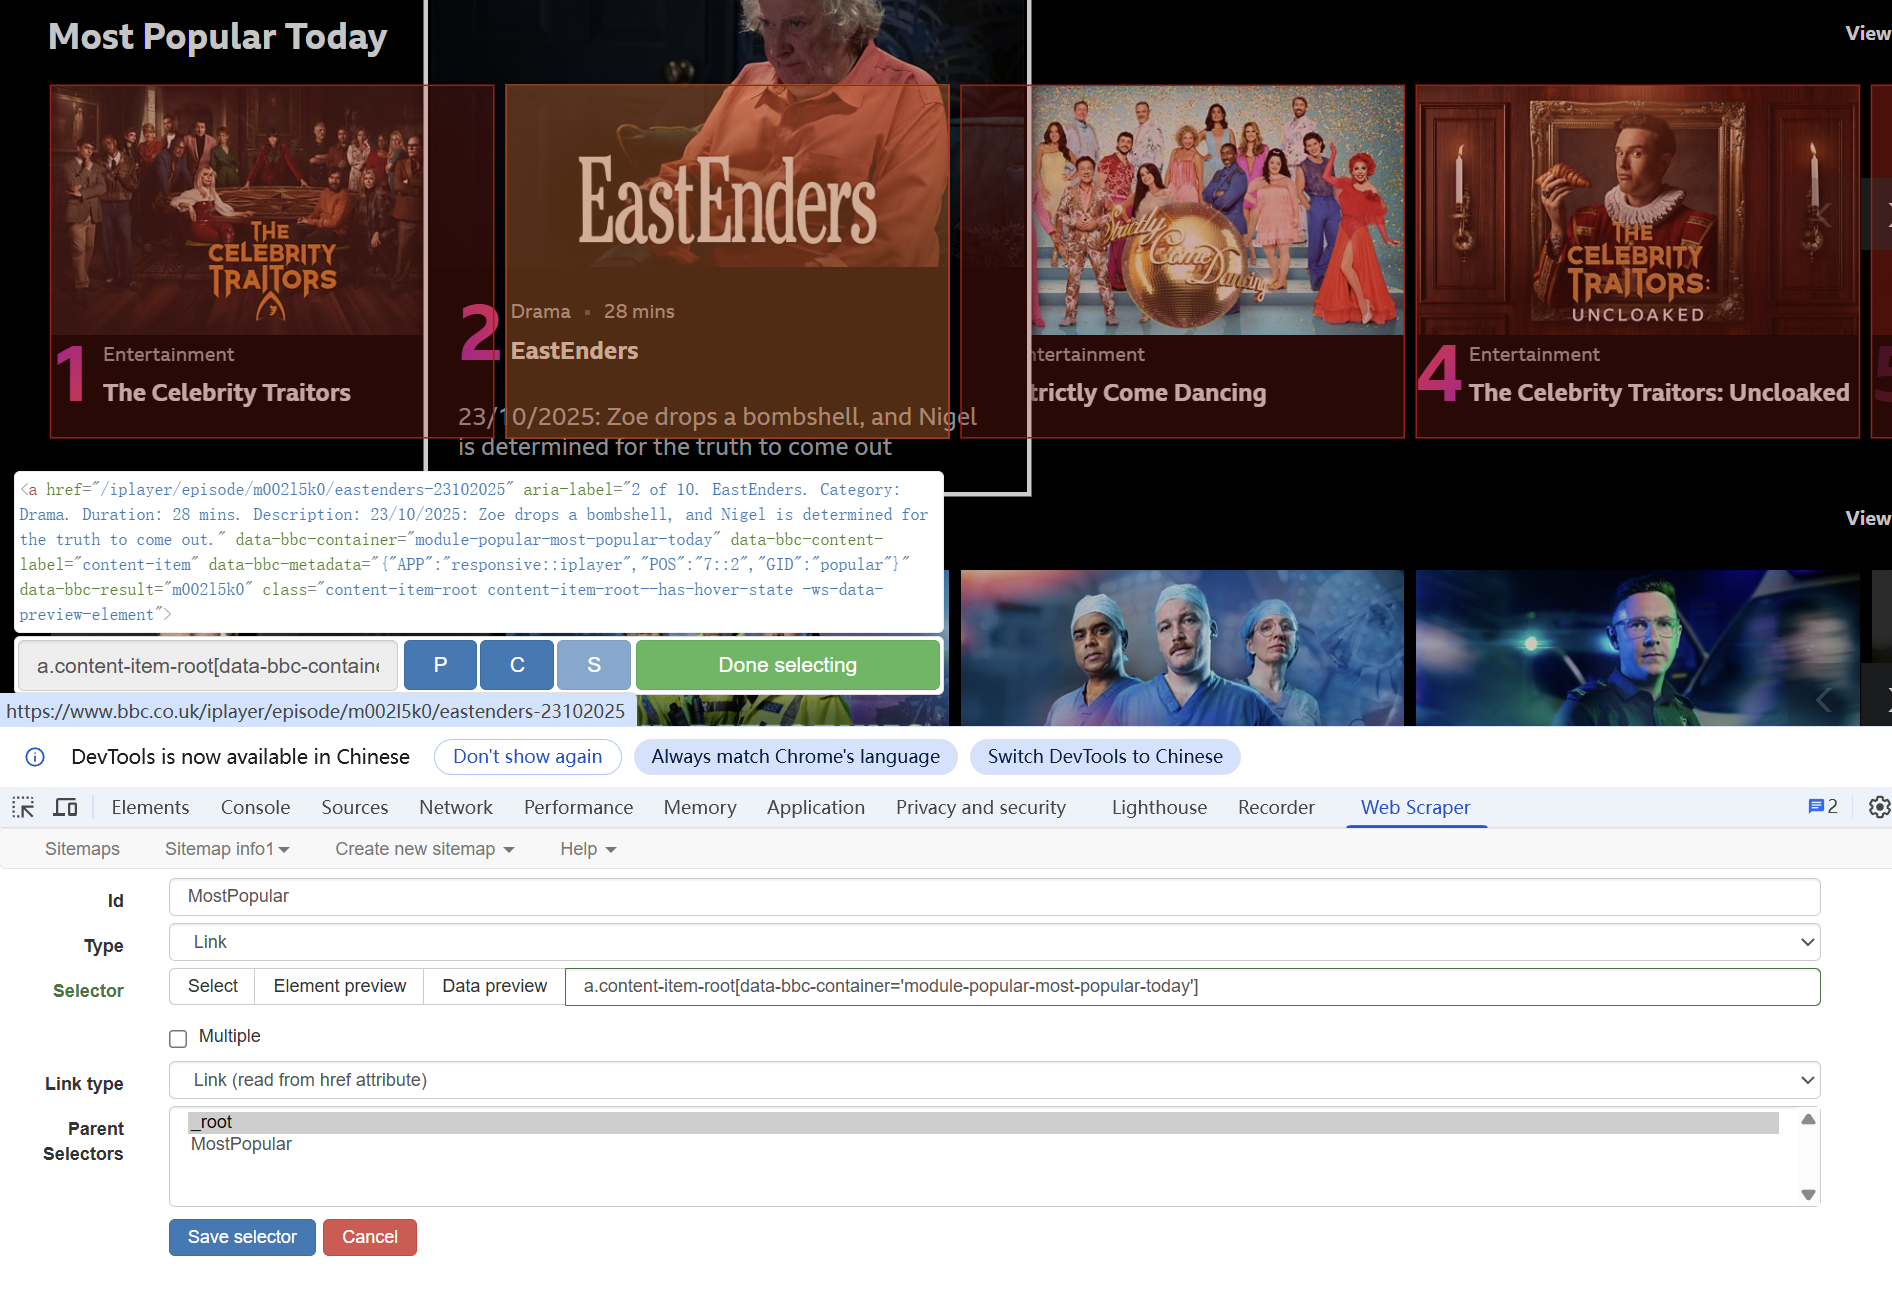
  1. First, open the scraper tool
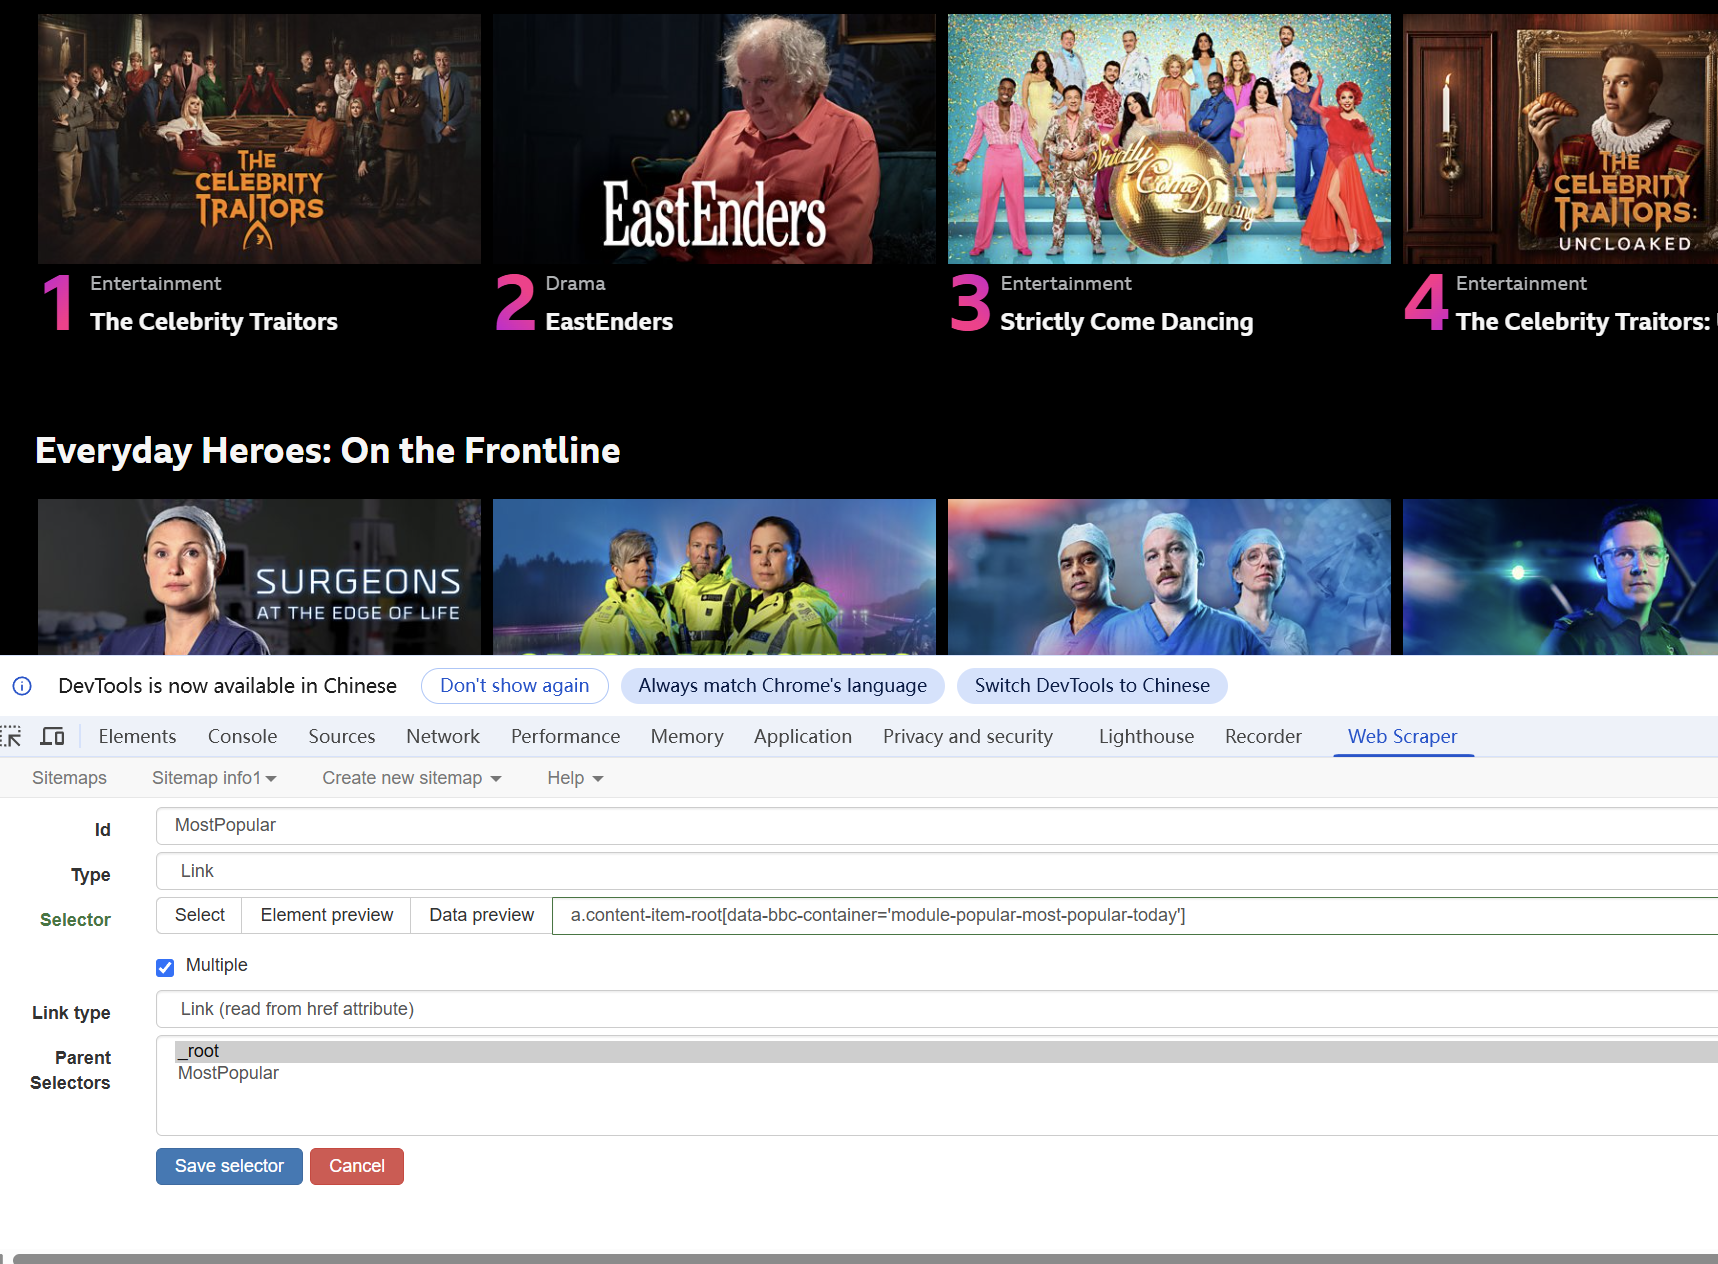
  2. Create a new sitemap and a new selector, linking the type of data you want to collect
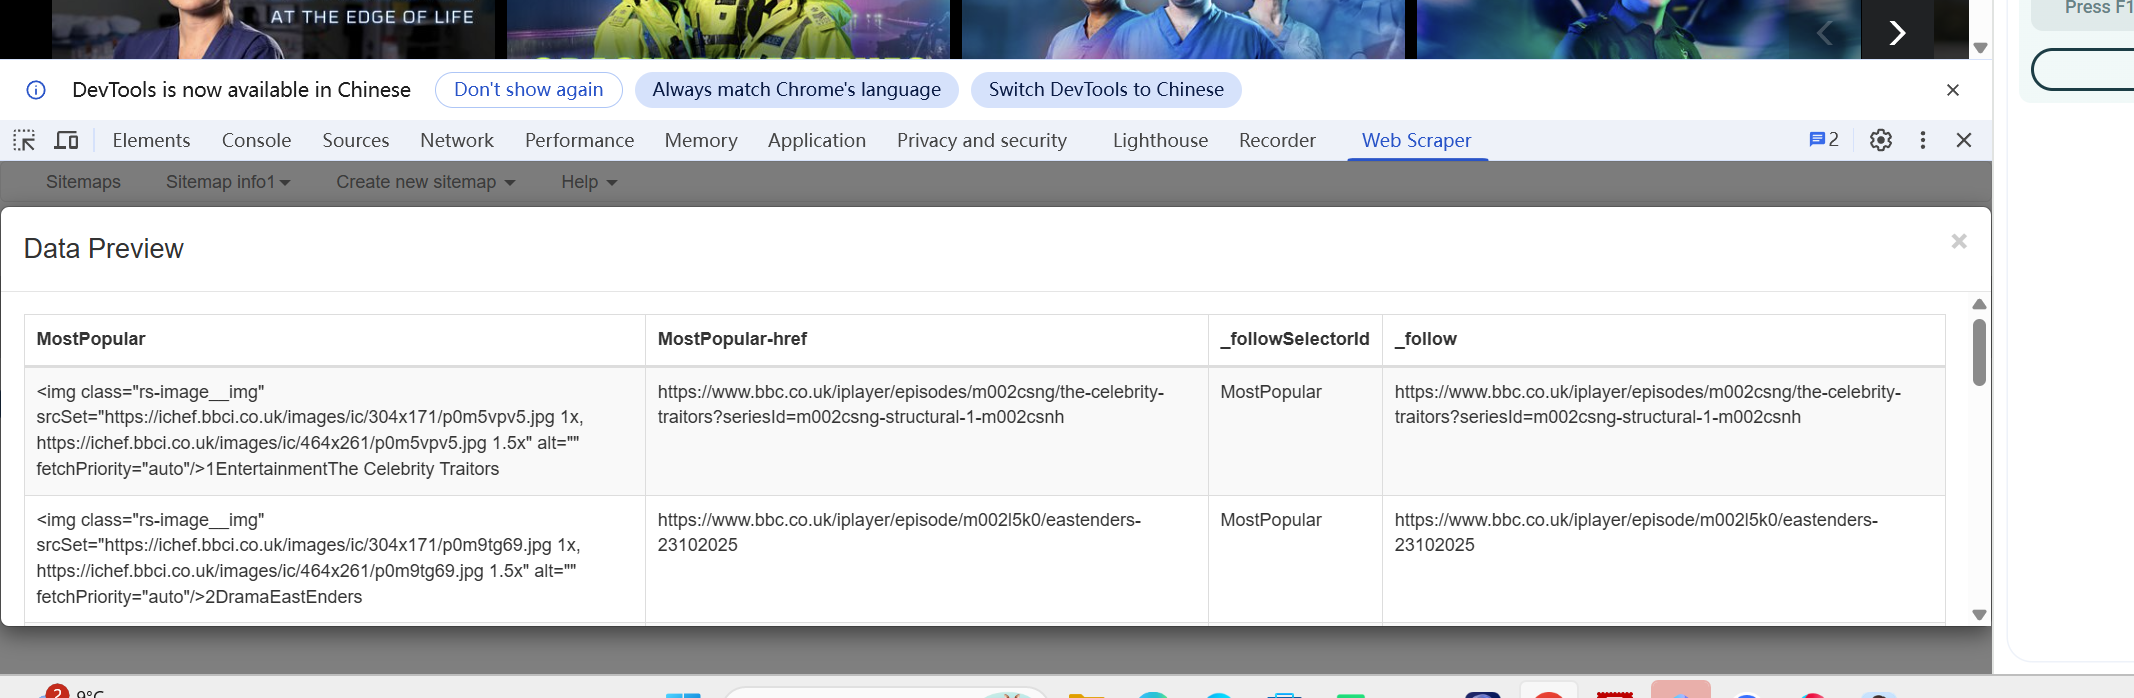
  3. Save the selector and open the data preview to check the results

However, the use of web crawlers poses significant ethical challenges. Firstly, much of the data on platforms constitutes proprietary information exclusive to companies, embodying their operational investments and intellectual property rights. Unauthorized crawling of such data essentially infringes on these proprietary rights, violating platform management rules and ethical norms (Gillespie, 2018). Secondly, unrestricted use of web crawlers continuously consumes server bandwidth and computing resources. This excessive resource depletion may exceed the platform’s load capacity, hindering normal access for regular users—an abuse of shared network resources that contradicts the principles of rational regulation in the sharing economy (Erickson & Sørensen, 2016). Such practices not only disrupt platform operations but also undermine the rights and interests of other users, highlighting the need for ethical restraint in crawler usage.

Scraper tool interface
Scraper tool initial interface
Creating a selector
Setting up a new selector
Data preview
Previewing collected data

Week 4

The Week 4 workshop on data and data analysis, focused on student use of generative AI for webpage creation, transformed my understanding of "objective" data. Our group designed a survey (later implemented with 12 student respondents, 50 variables) under the researcher-led scenario, aiming to map AI tool usage (e.g., code-writing, webpage building). This process revealed gaps between theoretical data ethics and practical implementation.

Crawford’s (2021, p.121) claim that data practices are "acts of world-making" became tangible when designing survey questions. We initially framed variables around "frequency of AI use" and "tool preference," but our small sample (n=12) and overrepresentation of tech-related disciplines (6/12 respondents) showed how data is shaped by who is counted—echoing D'Ignazio and Klein’s (2020, p.97) "what gets counted counts." We omitted questions about AI access barriers, ignoring students without tech resources, which reinforced Majias and Couldry’s (2024) warning about data gaps perpetuating power imbalances.

Ethical considerations also exposed contradictions. While we included consent prompts, the survey’s focus on "useful AI features" (per Workshop Task 4) prioritized utility over student concerns about privacy—reflecting O’Neil’s (2016) critique of data weaponization through biased framing. Personally, I realized my prior assumption that "more variables equal better data" was flawed; our 50 variables included redundant score columns that added no analytical value, wasting resources.

This experience shifted my perspective: data is not neutral. Next time, I would include questions on AI access and privacy concerns to address gaps, and use a larger, more diverse sample. It also made me question my own digital data footprint—how platforms like ChatGPT frame my usage data, mirroring our survey’s limitations (Gitelman & Jackson, 2013, p.3).

quiz
chart of the survey

Week 5

Week 5’s data visualisation workshop transformed my understanding of turning raw survey data into meaningful insights—this process is far more than technical manipulation; it is a critical act of interpreting and communicating data. Using Excel’s basic chart functions allowed me to quickly visualise data distributions, but I soon encountered its limitations: default templates failed to highlight key trends, and I spent significant time adjusting colours and layouts to enhance readability. In contrast, Tableau Public’s interactive features enabled audiences to explore relationships independently, which made me realise that tool selection must align with audience needs and the story the data intends to tell.

A critical reflection revealed that data visualisation is never “neutral.” Initially, I opted for pie charts to display categorical proportions without considering their ineffectiveness when there are multiple categories—this oversight obscured rather than clarified the data. This experience taught me that chart type should serve the data’s essence, not personal preference. Additionally, after reading Cai et al.’s (2024) visualisation of fan fiction data, I recognised a gap in my own work: I had not acknowledged potential biases, such as the limitations of my data collection scope, which could lead to misleading interpretations.

This practice reinforced that the core of data visualisation lies in balancing accuracy and narrative power. Moving forward, I will prioritise mapping variable relationships before choosing tools, and experiment with Flourish’s storytelling features to create visuals that are both rigorous and accessible. Furthermore, I aim to integrate cultural context into visualisations, drawing inspiration from Hickmon’s (2021) work that embeds cultural narratives within data, adding depth and human relevance to statistical presentations.

chart from quiz week4
chart1
chart from quiz week4
chart2
chart from quiz week4
chart3

Week 6

This workshop revealed how identity is both performed and processed in algorithmic systems. By manually applying Sumpter's framework to my Xiaohongshu network, I saw how digital selves are simplified into categories like "Lifestyle," "Product/Advertising," or "Jokes/Memes"—mirroring how platforms reduce complex identities to quantifiable data (Cheney-Lippold, 2017).

My data showed clear patterns but also significant gaps. Many posts did not fit Sumpter's 13 categories, forcing me to label them "others." This reflects how algorithmic taxonomies can erase nuanced expressions, such as subcultural interests (Benjamin, 2019). The absence of posts in "Politics/News" or "Activism" may indicate platform biases toward consumption-focused content.

Acting as the "human algorithm," I made subjective decisions about each post's meaning. This highlighted a key tension: automated systems classify based on metadata and engagement, while human interpretation considers context—yet both methods flatten narrative richness into data points. As van Dijck (2013) notes, platforms encourage coherent, compartmentalized self-presentation, and my matrix reproduced this logic.

The exercise underscores that digital identity is co-constructed: shaped by user agency, platform design, and the classifications imposed by algorithms or researchers. Truly understanding identity requires mixed methods—combining quantitative mapping with qualitative insights—and critical awareness of how race, gender, and culture shape visibility online (Noble, 2018; Sobande, 2020).

Ultimately, Sumpter's matrix is not a neutral reflection of my friends, but an artifact of the framework, my choices, and the platform's affordances. Recognizing this is essential for developing critical digital literacy in a datafied world.

Table 1: Content Classification of Xiaohongshu Posts Using Sumpter's Framework

Content Category Number of Posts Percentage Examples
Lifestyle 28 35% Daily routines, travel experiences, personal growth
Product/Advertising 22 27.5% Beauty products, fashion items, food reviews
Jokes/Memes 10 12.5% Funny images, trending memes, humorous videos
Food 8 10% Recipes, restaurant recommendations, cooking tips
Others 12 15% Subcultural interests, niche hobbies, creative content

Week 7

My experience with negative prompting in the AI workshop revealed the inherent limitations of generative AI’s predictive logic. I instructed the AI to avoid clichés like coincidental involvement or unclear motives in a murder story. The result was a technically coherent but deeply unimaginative narrative: I was cast as a bland land surveyor, the detective was a 20-year veteran, and the murderer’s motive was to prevent a report about an illegal granny flat. While logically consistent, every element felt like a prefabricated part from a generic crime drama toolkit.This outcome directly illustrates the “predictive and probabilistic tendency” of GenAI Munster (2025, p. 18).

My negative prompts did not foster true creativity; instead, they simply narrowed the field from which the AI could select the most statistically probable narrative components. By rejecting specific tropes, I inadvertently guided the model toward the safest, median-average patterns remaining in its training data.

The AI performed a form of computational statistics Broussard (2023, p. 12), assembling a story based on the most frequent correlations between “land surveyor,” “evidence,” and “motive” in its dataset. The process felt less like collaboration and more like negotiation with a system designed to average out input into conventional output.

Critically, this highlights a lack of meaningful heterogeneity in the AI’s response. Despite the vast, non-uniform data it was trained on, the model’s drive toward “homogenizing predictive structuration” Munster (2025, p. 39) overrode any potential for genuine variance.

My attempt to conceive of the experience differentially Munster (2025, p. 23)—to shape a unique story—was frustrated by the AI’s fundamental process of relating, which is to revert to established patterns. To make the AI truly “wander off task,” one would need to introduce deliberate, creative incongruity that forces it into less probable semantic spaces, challenging its structuration. This experiment underscores that without such intervention, GenAI often replicates normative, archetypal narratives, offering a computational experience that flattens complexity into predictable constructs.

My talk with DeepSeek

Week 8

After participating in this workshop, the digital ecology practices and multimodal expression experiences at Kirkgate Market have led me to a deeper reflection on the value and limitations of digital media. At the market, we captured and presented daily stories through multimodal approaches, and the headphone-assisted auditory taste discrimination experiment further broke down sensory boundaries—when identifying liquids solely through sound, divorced from vision and taste, I realized that digital technology can restructure perceptual dimensions. This aligns perfectly with the core insight proposed by Searle et al. (2024) in Digital Ecologies that "digital media connect human and more-than-human worlds.

This experience has prompted me to delve into the application potential of technologies such as VR/AR. These technologies can transcend physical spatial constraints, allowing people in remote areas to "be present" at the market and enabling disabled groups to access information through customized sensory designs—exactly the inclusivity that digital ecologies strive for. However, the "intersectionality" perspective emphasized by Sabin (2024) in Breathe for Ella: artivism, intersectionality and sensing air pollution reminds me that technological inclusion cannot remain superficial. If VR/AR content design overlooks the perceptual differences, economic conditions, or digital literacy of diverse groups, it will instead exacerbate information inequality—just as air pollution disproportionately impacts marginalized communities, the distribution of digital technology dividends may also suffer from a "digital divide."

Even more concerning is the issue of digital ecology sustainability. Gabrys (2013, p.243) in Digital Rubbish: A Natural History of Electronics reveals the environmental costs of electronic devices, reminding us that the "virtual reality" constructed by technology is not a castle in the air divorced from material foundations. As we pursue immersive experiences, we cannot ignore the resource consumption and environmental pollution behind hardware production and data storage. A truly equitable and sustainable digital ecology should not merely pursue technological advancement but also embody the philosophy of "less is more"—such as optimizing algorithms to reduce energy consumption and adopting recyclable hardware—allowing technology to serve the symbiosis between humans and the environment.

Critically, this highlights a lack of meaningful heterogeneity in the AI’s response. Despite the vast, non-uniform data it was trained on, the model’s drive toward “homogenizing predictive structuration” Munster (2025, p. 39) overrode any potential for genuine variance.

This practice has made me understand that the value of digital media in building an equitable ecology lies not only in technological empowerment but more importantly in critical design thinking. We need to examine technological applications through an intersectional lens, accommodate the diverse needs of different groups, and embed environmental sustainability into the entire process of technological research and development. Only in this way can digital ecologies truly become a bridge connecting the diverse world and promoting social justice (Turnbull et al., 2024).

Bottles
Listening the bubbles in the bottles(It sounds like fermentation)

My practical experience

In the market, we passed by many shops, such as pastry shops and flower shops, but the ones that left the deepest impression on me were the fish market and CD store.

The fish market at Kirkgate Market is steeped in a crisp winter chill both inside and out, with the air tinged by the coolness of crushed ice — yet the approaching Christmas atmosphere adds a soft warmth to the cold. Beside the yellow, white, and blue paper lanterns hanging above the stalls, delicate festive decorations dangle faintly; warm yellow light wraps around the cold glow of the ice mounds, softening the harshness of winter.

On the stalls, a bright yellow price tag reading "WILD LARGE SQUID" (priced at £28.00/KG) stands out prominently. Each wild giant squid, pale pink all over with fine specks, is wrapped in translucent white ice shards, its semi-transparent flesh exuding a fresh, moist vitality. Their curled tentacles are dusted with tiny ice crystals, arranged in an irregular display alongside brown-shelled whelks and plump pale blue-green shrimp.

their skin is as smooth as water-rinsed grape skin—covered in a thin, cool film of moisture, neither sticky nor dry, slipping away from the tip of your finger with the chill of the ice shards. When you lean in to smell them, there is no overpowering odd odor, only a subtle salty freshness: like the moist, briny scent carried by the wind after a coastal low tide. The crushed ice coating the squids glimmers with a translucent white luster, while their skin shimmers faintly. At the sight of them, you can almost feel their icy coldness, evoking the frozen seas of a Viking winter. When we use analogy to tell readers what the touch, smell, and flavor of squid are, even if they have never seen squid before, readers will still have some associations.

On the other side of the market, small supermarkets from various countries gather for retail. The CD/music store in this corner exudes a strong retro and nostalgic atmosphere:

The shelves and plastic boxes are filled with vinyl records and DVD discs, densely packed - ABBA's classic records, John Wayne's westerns, and vintage horror discs are arranged in a staggered manner, as if mixing memories of different eras into this small space, exuding a lively atmosphere of "shopping".

The handwritten "ALL CASES ARE EMPTY" sign and the straightforward "Black Glue for Sale" slogan add a touch of market casualness; Discs do not need to be displayed delicately, but instead are piled up in boxes and squeezed on shelves, making the entire space appear rich and relaxed, like a "secret corner" full of vintage treasures, suitable for leisurely searching, and able to discover audio-visual surprises from different eras, with both the warmth of old objects and the unique fireworks atmosphere of the market.

Seafood
Sushi Shop
Seafood
Salmon
Seafood
Squid
Seafood
CD Market
Kirkgate Market CD store
The sound of music in the store

Week 9

Week 9’s Arduino workshop, focusing on the Love-o-meter task from the Arduino Starter Kit Classroom Pack, blended hands-on creative hacking with critical insights into bodily sensing. What began as a simple exercise—using a TMP36 sensor to measure body temperature and trigger LEDs—revealed deeper questions about how digital tools quantify human experience, shaped by scholarly perspectives.

Lupton’s (2016) “Quantified Self” framework highlighted how the task reduced complex bodily sensations and emotions to numerical data, oversimplifying human complexity. Forlano’s (2016) critique of ableist tech biases further resonated: Arduino’s standardised components and tasks risk ignoring diverse bodily abilities, while our group’s sensor calibration struggles showed how “success” is defined by narrow, normative metrics.

Burgess et al. (2022) and Whitson (2013) added context: Arduino democratises digital making, but stock tasks can encourage passive data collection over critical thinking. The workshop’s “failures”—unreliable readings, time constraints—became valuable, mirroring the messiness of bodily data and challenging tech neutrality. We even found ourselves manipulating our hands to alter sensor outputs, blurring lines between measuring and performing for the device.

This experience taught me creative hacking is as much about questioning tools as building them. Arduino’s accessibility empowers experimentation, but scholarly engagement is key to avoiding oppressive bodily norms. Future projects will blend technical skill with a focus on diverse bodies, moving beyond measurement to honour sensory complexity.

My talk with DeepSeek
Our work

Week 10

Participating in the workshop to develop a non-linear interactive game about rebirth in a doomsday mall and fighting zombies using Twine has deepened my understanding of interactive narratives. This experience allowed me to bridge theoretical concepts with practical creation, bringing both insights and critical reflections.

Aarseth’s (1997) definition of cybertext as a "machine for the production of a variety of expression" became tangible during development. Unlike linear narratives, our game designed multiple story pathways—for example, choosing to search for weapons or rescue survivors led to distinct endings. This aligns with Murray’s (1997, cited in Salter, 2018) view of interactors as "authors of a particular performance," as players’ choices directly shaped the narrative. The Twine Cookbook (n.d.) proved invaluable, guiding us to implement variables and conditional logic to enhance interactivity, such as adjusting health levels based on in-game decisions.

However, challenges emerged. Balancing narrative coherence with player freedom was tricky—some branching paths felt underdeveloped due to time constraints, highlighting the tension between procedural authorship and meaningful player agency. Additionally, while Twine’s accessibility (no prior coding required) empowered our group, its limited customization for complex gameplay mechanics made certain zombie-fighting dynamics hard to realize.

This experience reinforced that interactive narratives demand both creative vision and technical rigor. I learned to prioritize core pathways while ensuring each choice felt impactful, and gained appreciation for the iterative nature of non-linear design. Critically, it revealed that true interactivity is not just about multiple options, but about making those options emotionally resonant. Moving forward, I would allocate more time to playtesting and leverage Twine’s advanced features (e.g., CSS customization) to address mechanical limitations, creating a more immersive experience that fully embodies the potential of cybertext and ergodic literature.

My talk with DeepSeek
Reborn in the Apocalypse: Fighting Zombies in the Kirkgate Market

Week 14

During the Week 14 seminar on group work, our team planned to develop a web-based interactive story with branching choices around digital storytelling. We generated multiple proposals oriented towards social issues (such as a rental safety simulation for women living alone, a parenting simulation for young parents, among others). While these initial ideas were relevant and promising, our discussion remained largely at the "interesting" stage, lacking deeper screening and definition.

I learned that selecting a final theme from diverse ideas requires rigorous critical evaluation. A viable project theme must go beyond superficial appeal to possess clear social insight, a core target audience, and technical and narrative feasibility (Murray, 1997; Ryan, 2006). The key in the creative phase is to question: among the options, which topic can best deliver a profound experience through interactivity? Do its mechanisms truly serve the core message?

We are aware that while the assignment requirements focus on the form, the form ultimately serves the subject matter. We need to select our theme carefully and find relevant supporting materials. We hope to flexibly apply our accumulated experience this time to write a well-crafted 1000-word report and deliver a successful outcome.

References

  1. Benjamin, R. 2019. Race After Technology. Polity.
  2. Cheney-Lippold, J. 2017. We Are Data. New York University Press.
  3. Noble, S. U. 2018. Algorithms of Oppression. New York University Press.
  4. Sobande, F. 2020. The Digital Lives of Black Women in Britain. Palgrave.
  5. van Dijck, J. 2013. 'You have one identity'. Media, Culture & Society, 35(2), pp.199–215.
  6. Broussard, M. 2023. *More than a Glitch: Confronting Race, Gender, and Ability Bias in Tech*. Cambridge, MA: The MIT Press.
  7. Munster, A. 2025. Introduction. In: *DeepAesthetics: Computational Experience in a Time of Machine Learning*. London: Duke University Press, pp. 1-39.
  8. Gabrys, J., 2013. Digital rubbish: A natural history of electronics. Ann Arbor: University of Michigan Press.
  9. Sabin, L., 2024. Breathe for Ella: artivism, intersectionality and sensing air pollution. Artnodes, (33), pp.1-10.
  10. Searle, A., Giraud, E.H., Turnbull, J. & Anderson-Elliot, H., 2024. Introduction: what is Digital Ecologies? In: Turnbull, J., Searle, A., Anderson-Elliot, H. & Giraud, E.H., eds. Digital Ecologies: Mediating More-Than-Human Worlds. Manchester: Manchester University Press, pp.1-20.
  11. Turnbull, J., Searle, A., Anderson-Elliott, H. & Giraud, E.H., 2024. Digital ecologies. Manchester: Manchester University Press.
  12. Burgess, J., Albury, K., McCosker, A. and Wilken, R. 2022. Everyday data cultures. Cambridge: Polity.
  13. Whitson, J.R. 2013. Gaming the Quantified Self. Surveillance & Society, 11(1/2), pp.163-176.
  14. Cai, A., Sutanto, F., Diehm, J. and Ralph, C. 2024. Who Gets Shipped and Why? [online] The Pudding. Available at: https://pudding.cool/2024/10/fanfic/ (Accessed: 1/12/2025).
  15. Feigenbaum, A. and Alamalhodaei, A. 2020. Visual Data Storytelling. In: The Data Storytelling Workbook. London: Routledge.
  16. Hickmon, G.I. 2021. How You Play Spades Is How You Play Life: Spades in the African-American Community [online] The Pudding. Available at: https://pudding.cool/2021/08/spades (Accessed:1/12/2025).
  17. Erickson, K. and Sørensen, I. 2016. Regulating the Sharing Economy. Internet Policy Review, 5(2), pp. 1-13. https://doi.org/10.14763/2016.2.414.
  18. Gillespie, T. 2018. Custodians of the Internet: Platforms, Content Moderation, and the Hidden Decisions That Shape Social Media. New Haven: Yale University Press.
  19. Zhang, W., Chen, Z. and Xi, Y. 2021. Traffic Media: How Algorithmic Imaginations and Practices Change Content Production. Chinese Journal of Communication.
  20. Murray, J.H. (1997) Hamlet on the Holodeck. New York: The Free Press.
  21. Ryan, M.L. (2006) Avatars of Story. Minneapolis: University of Minnesota Press.

Get In Touch

I'd love to hear from you! Whether you have questions, collaboration ideas, or just want to connect, feel free to reach out.

Contact Information